Every year, districts receive one of the most important pictures of how their students are performing. Your board wants answers. Your principals want direction. Your teachers want to know what it means for their classrooms. And it’s all packaged in one of the largest spreadsheets you’ll ever be handed.
We turn that raw data into clear reports, usable workbooks, and concrete next steps all designed to help you see your systems and support your students.
The TOMS data download is built for data analysts. Distance from Standard, student growth percentiles, claim-level performance, subgroup disaggregations—it takes real expertise to pull meaningful signal from all of it, and most small districts don't have a dedicated analyst to do it.
Your CAASPP results feed directly into your California Dashboard accountability ratings, shape your LCAP priorities, and define the story your community tells about your schools. You need to understand your data—and communicate it clearly—before someone else tells the story for you.
Real improvement requires both system-level analysis and student-level action. You need to understand where your district is and where it's headed—and you need to be able to see individual students who need attention. Both matter. Most analysis tools give you one or the other.
Every table, chart, and graph in this package has been designed with a specific question in mind. The structure of the analysis—what to look at, in what order, with what context—comes from over 15 years of direct work with California student data: in the classroom, in the district office, and in collaborative data sessions with leadership teams. We've led data analysis at admin retreats and school site PLCs. We've coached teams through the work of turning assessment results into instructional priorities. The analysis framework is ours; we use technology to execute it well at scale.
Your data is handled with the seriousness it deserves. All file transfer, storage, and communication of student data is fully FERPA compliant. You upload to a protected folder; we process and return your deliverables through the same secure channel. We never have direct access to your systems or any student records beyond what you share.
Four deliverables you won't find packaged together anywhere else—each one designed to answer a question your district actually needs answered.
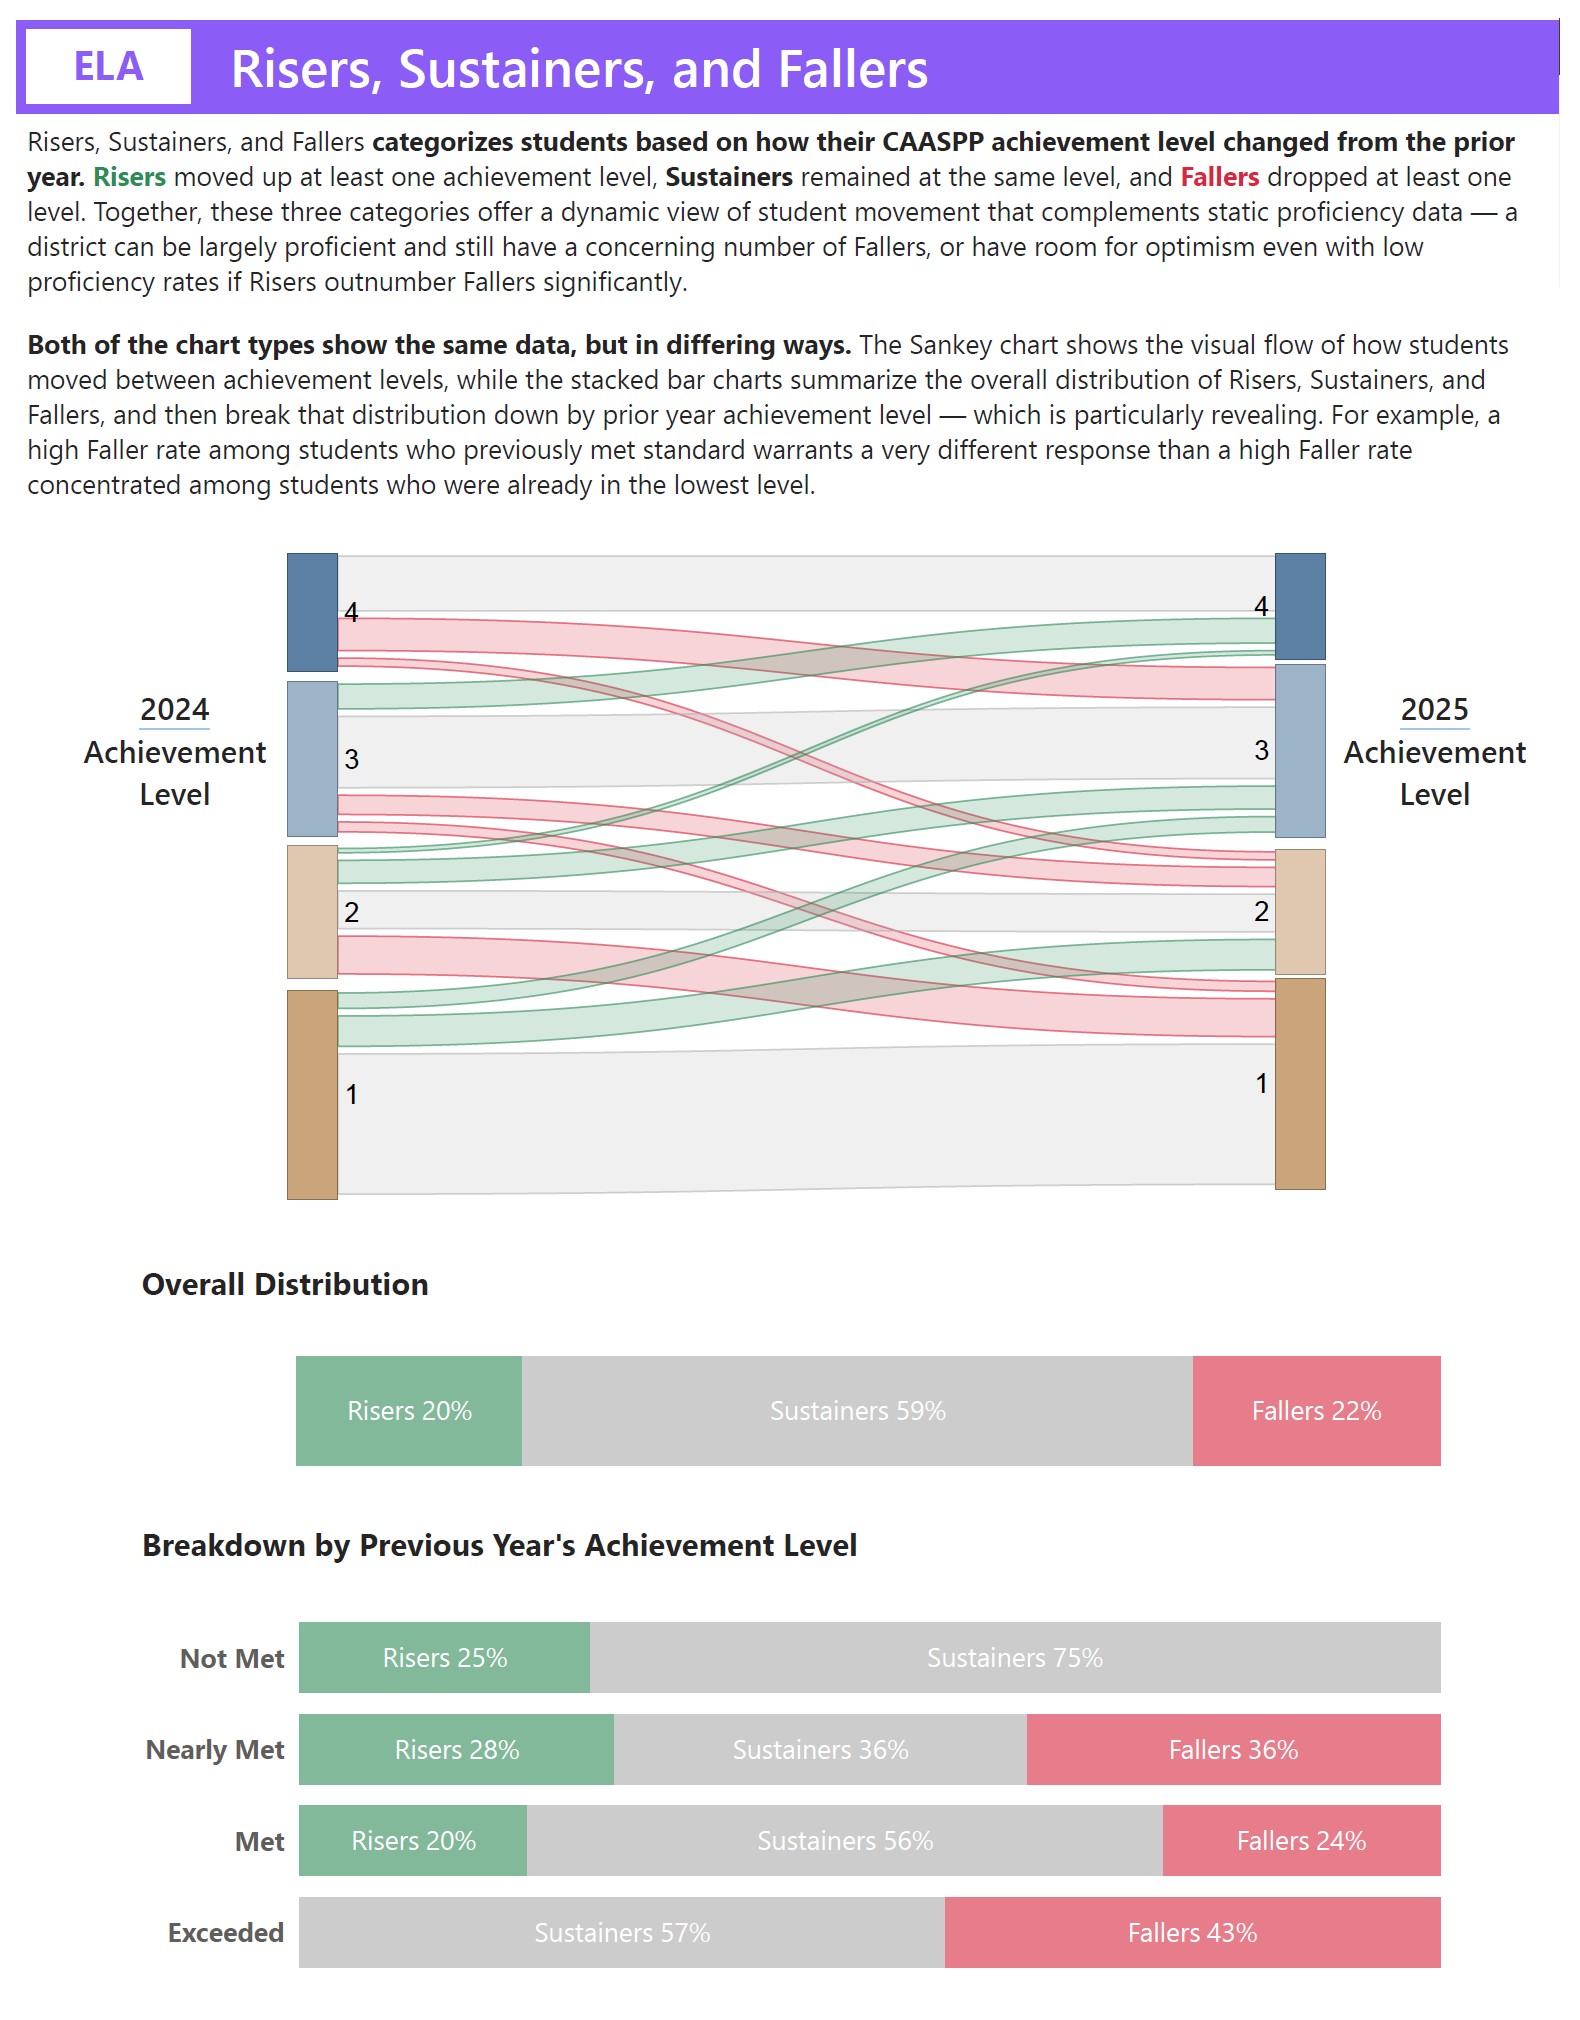
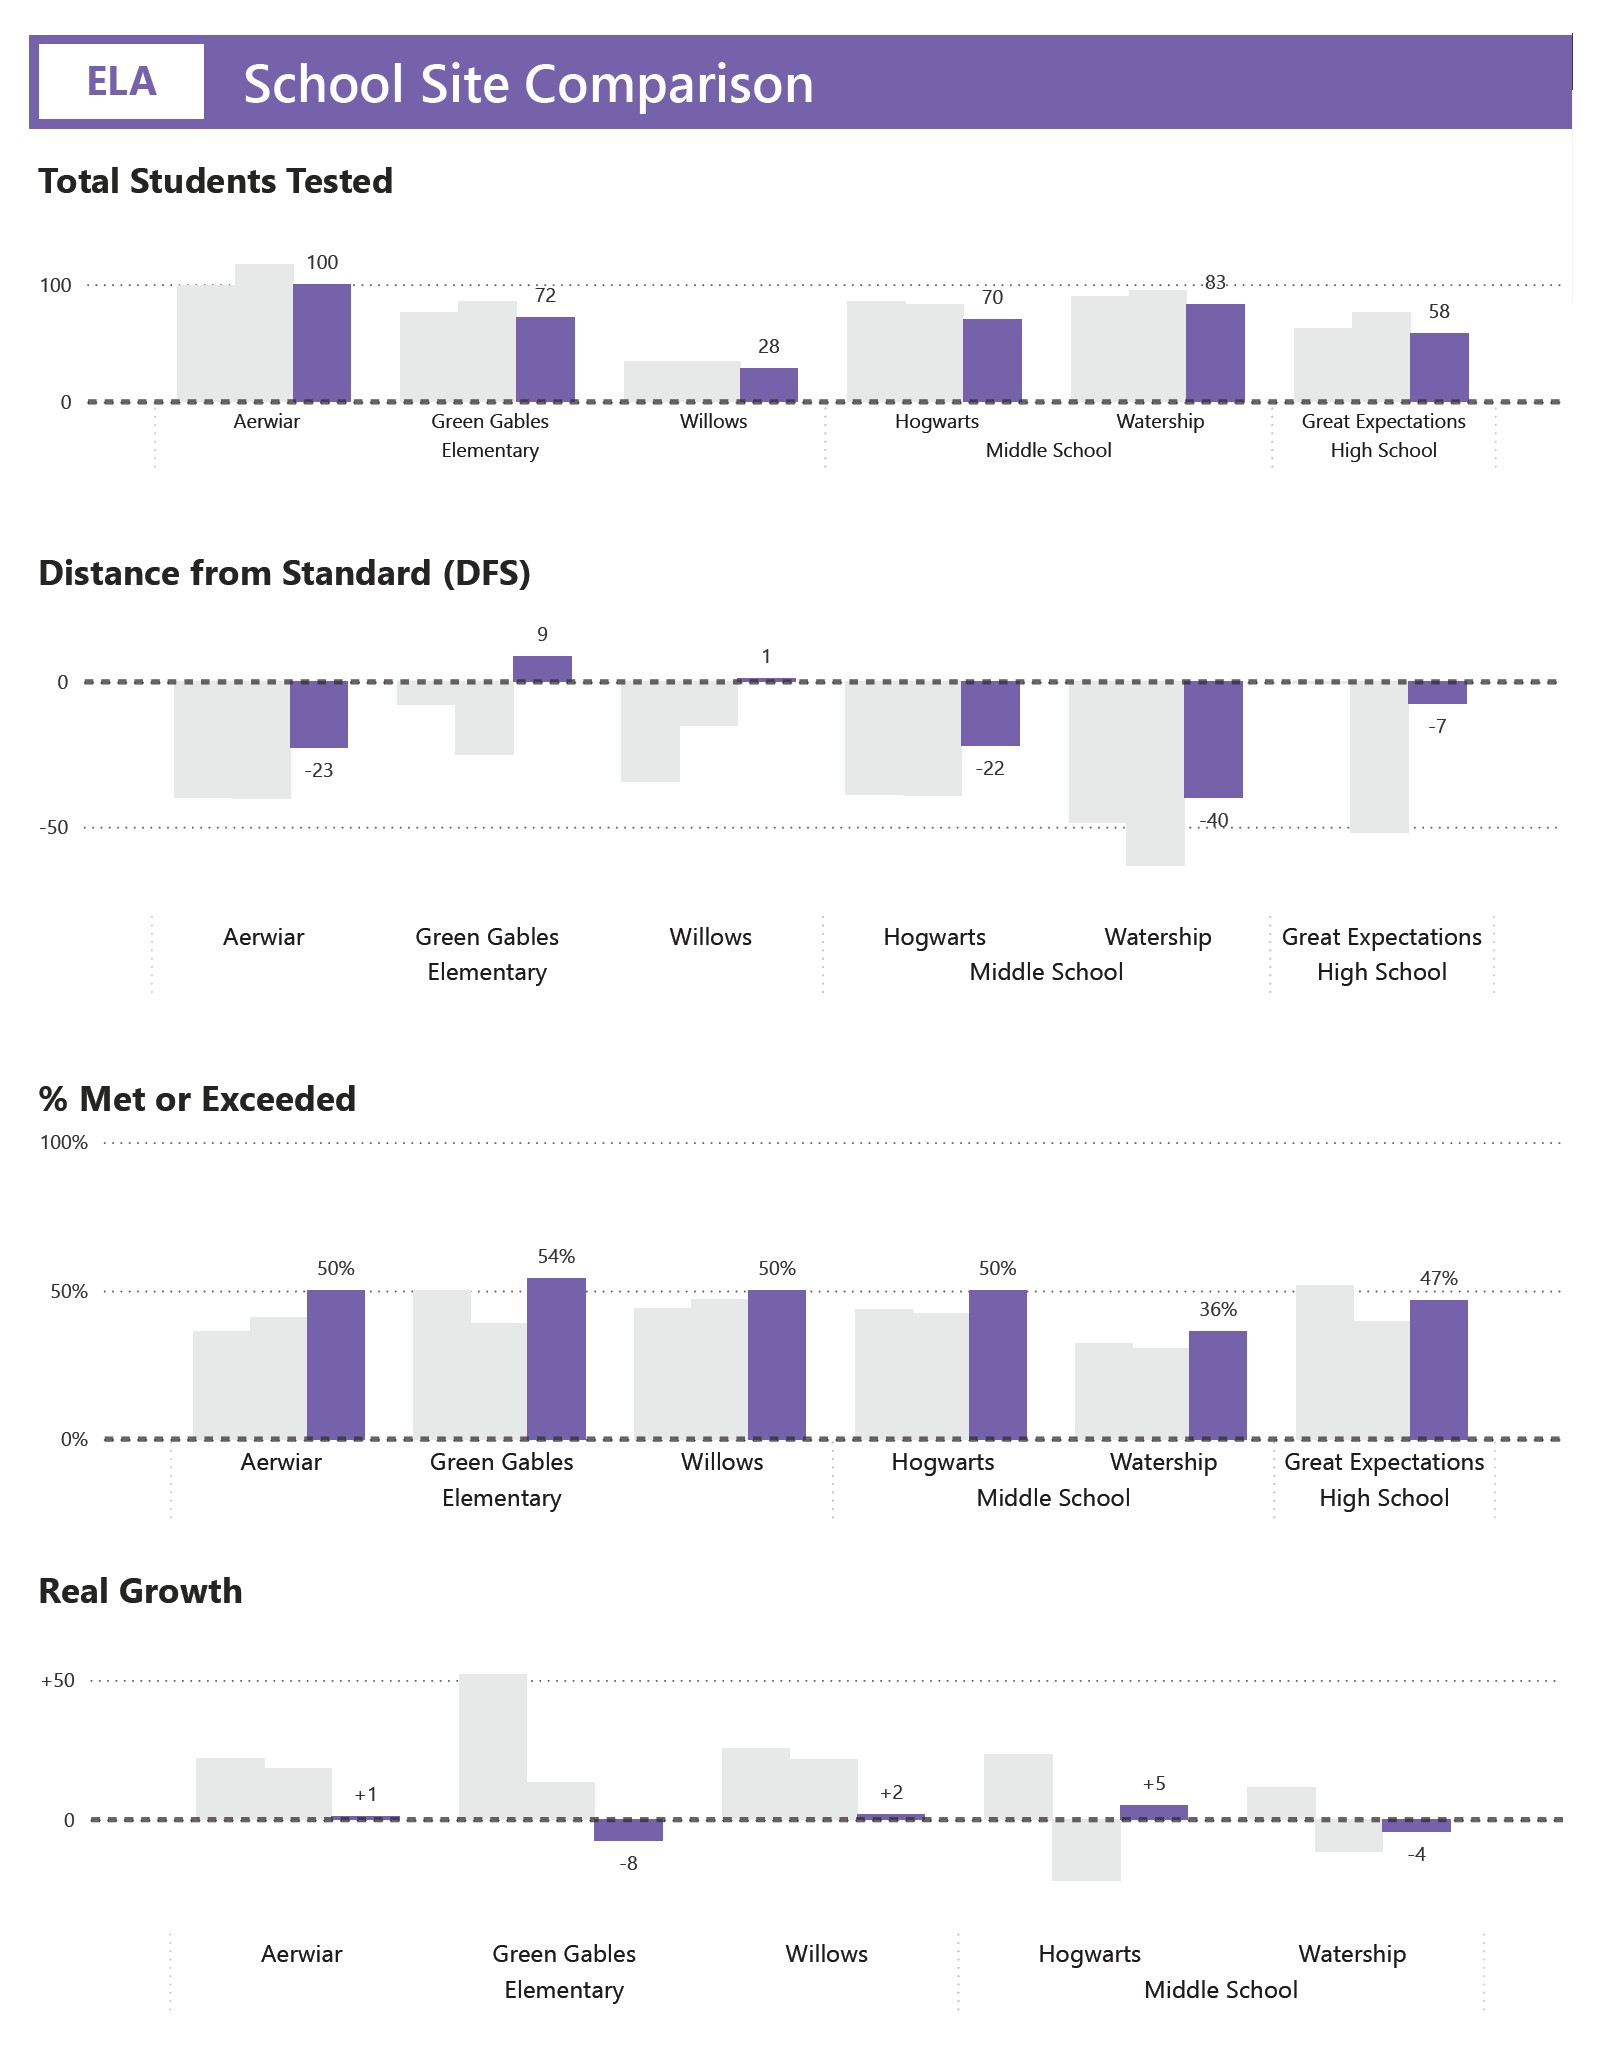
Instead of one sprawling report, you get three focused analyses—one per subject—each built around the questions that matter most for that content area. Distance from Standard, Percent Met and Exceeded, multi-year trends, achievement level breakdowns, subgroup disaggregations, and site-by-site comparisons. The depth of a comprehensive analysis, organized so it's actually usable by curriculum leads and content coaches—not just data staff.
Covers CAASPP ELA and Math results plus CAST (California Science Test) results.
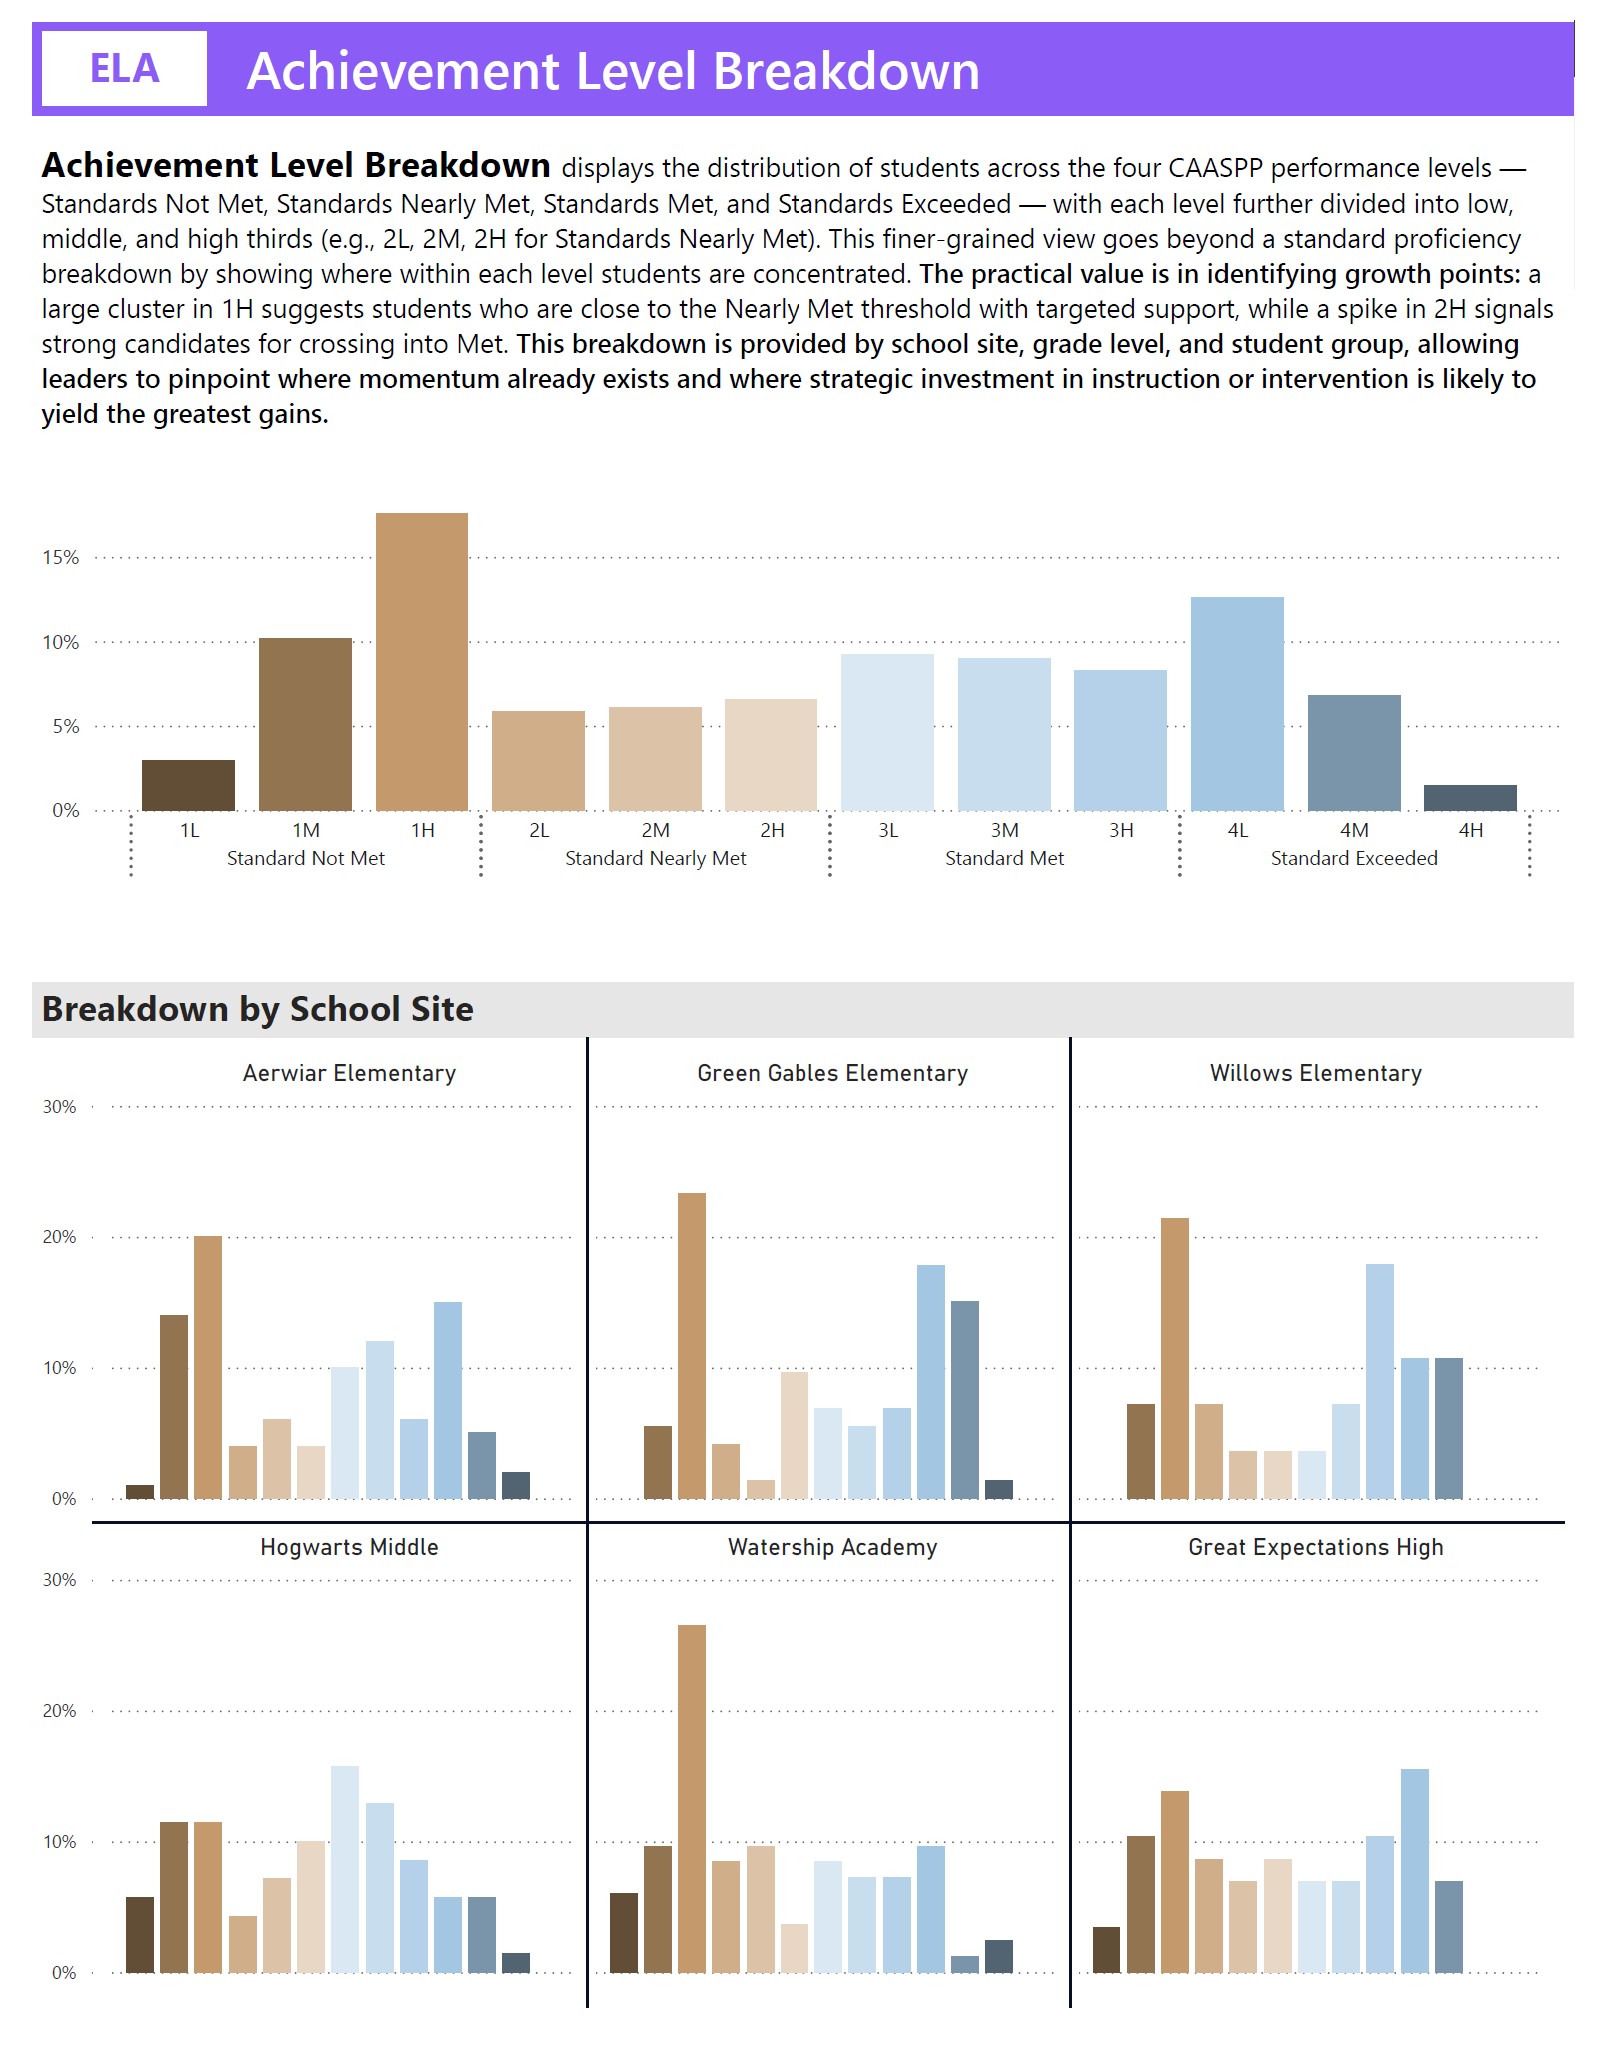
Click any image to enlarge
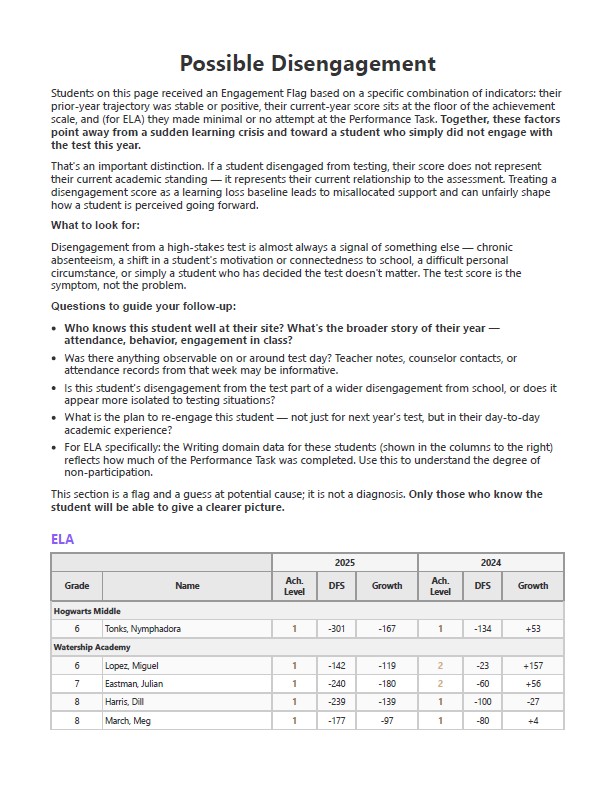
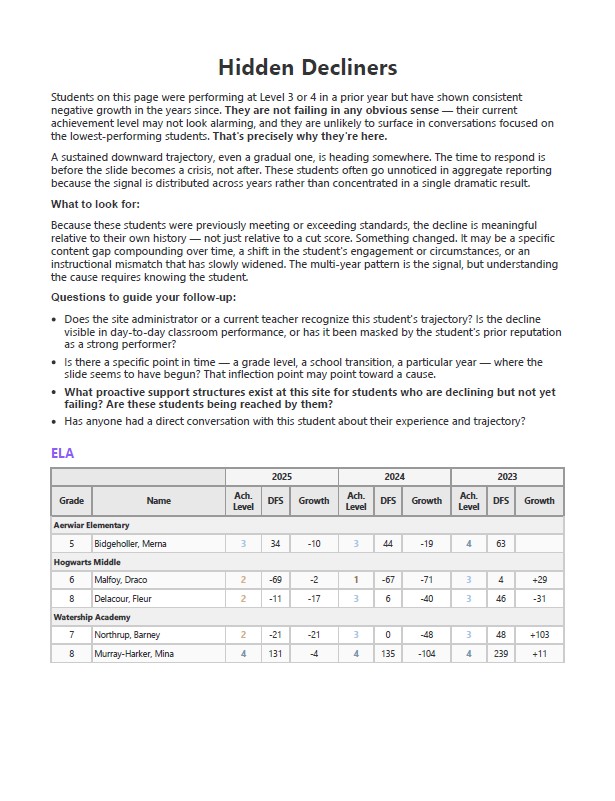
This is where the system-level analysis connects to individual students. For each student, the report identifies their performance level, growth trajectory, and specific, prioritized next steps for teachers and coaches. Not generic recommendations—actual action steps grounded in your district's results. Designed for principals and instructional coaches to use at the start of a new year, in PLC meetings, or during individual teacher coaching conversations.
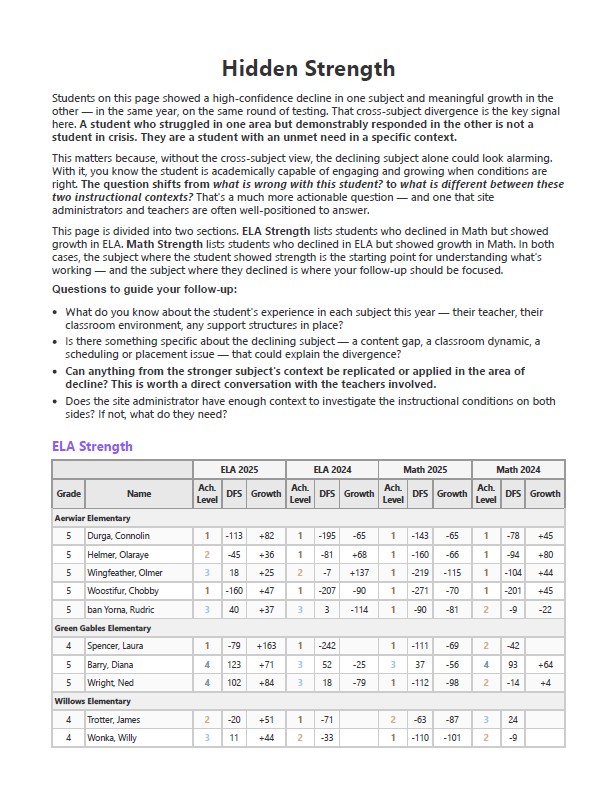
Click any image to enlarge
A live, interactive Power BI dashboard built from your district's results. Filter by school site, grade level, subject, or student group. Toggle between metrics. See your data move in real time instead of hunting through static pages. Built for administrators who want to explore their results independently—and for leadership team meetings where the data needs to be visible and discussable in the room.
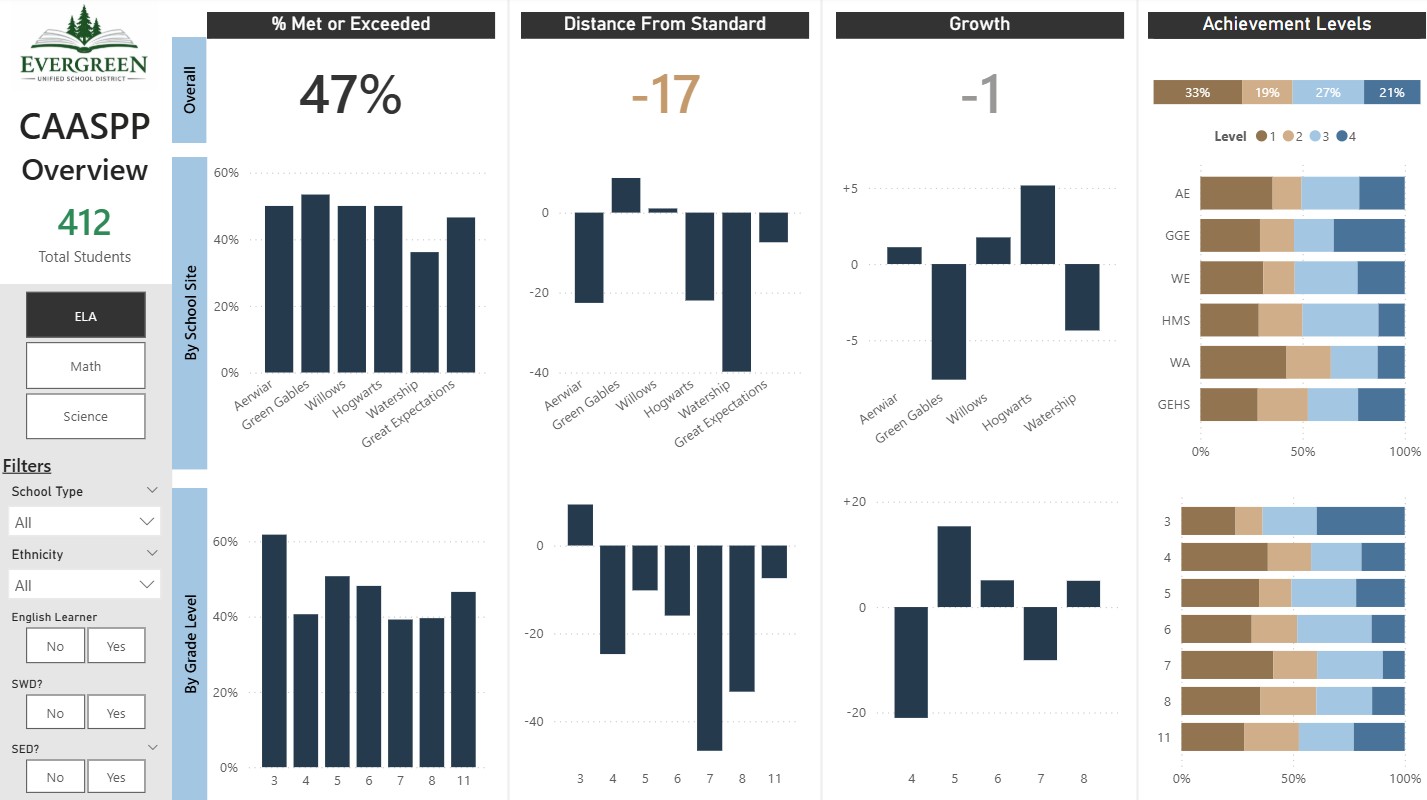
Click to enlarge
Your CAASPP results feed directly into your California Dashboard accountability ratings—but the connection isn't obvious, and most districts don't know where they stand until the Dashboard is published months later. This standalone report shows you what your current results predict for your Dashboard color, by indicator and student group, before anyone else sees it. Know your trajectory early enough to act on it.
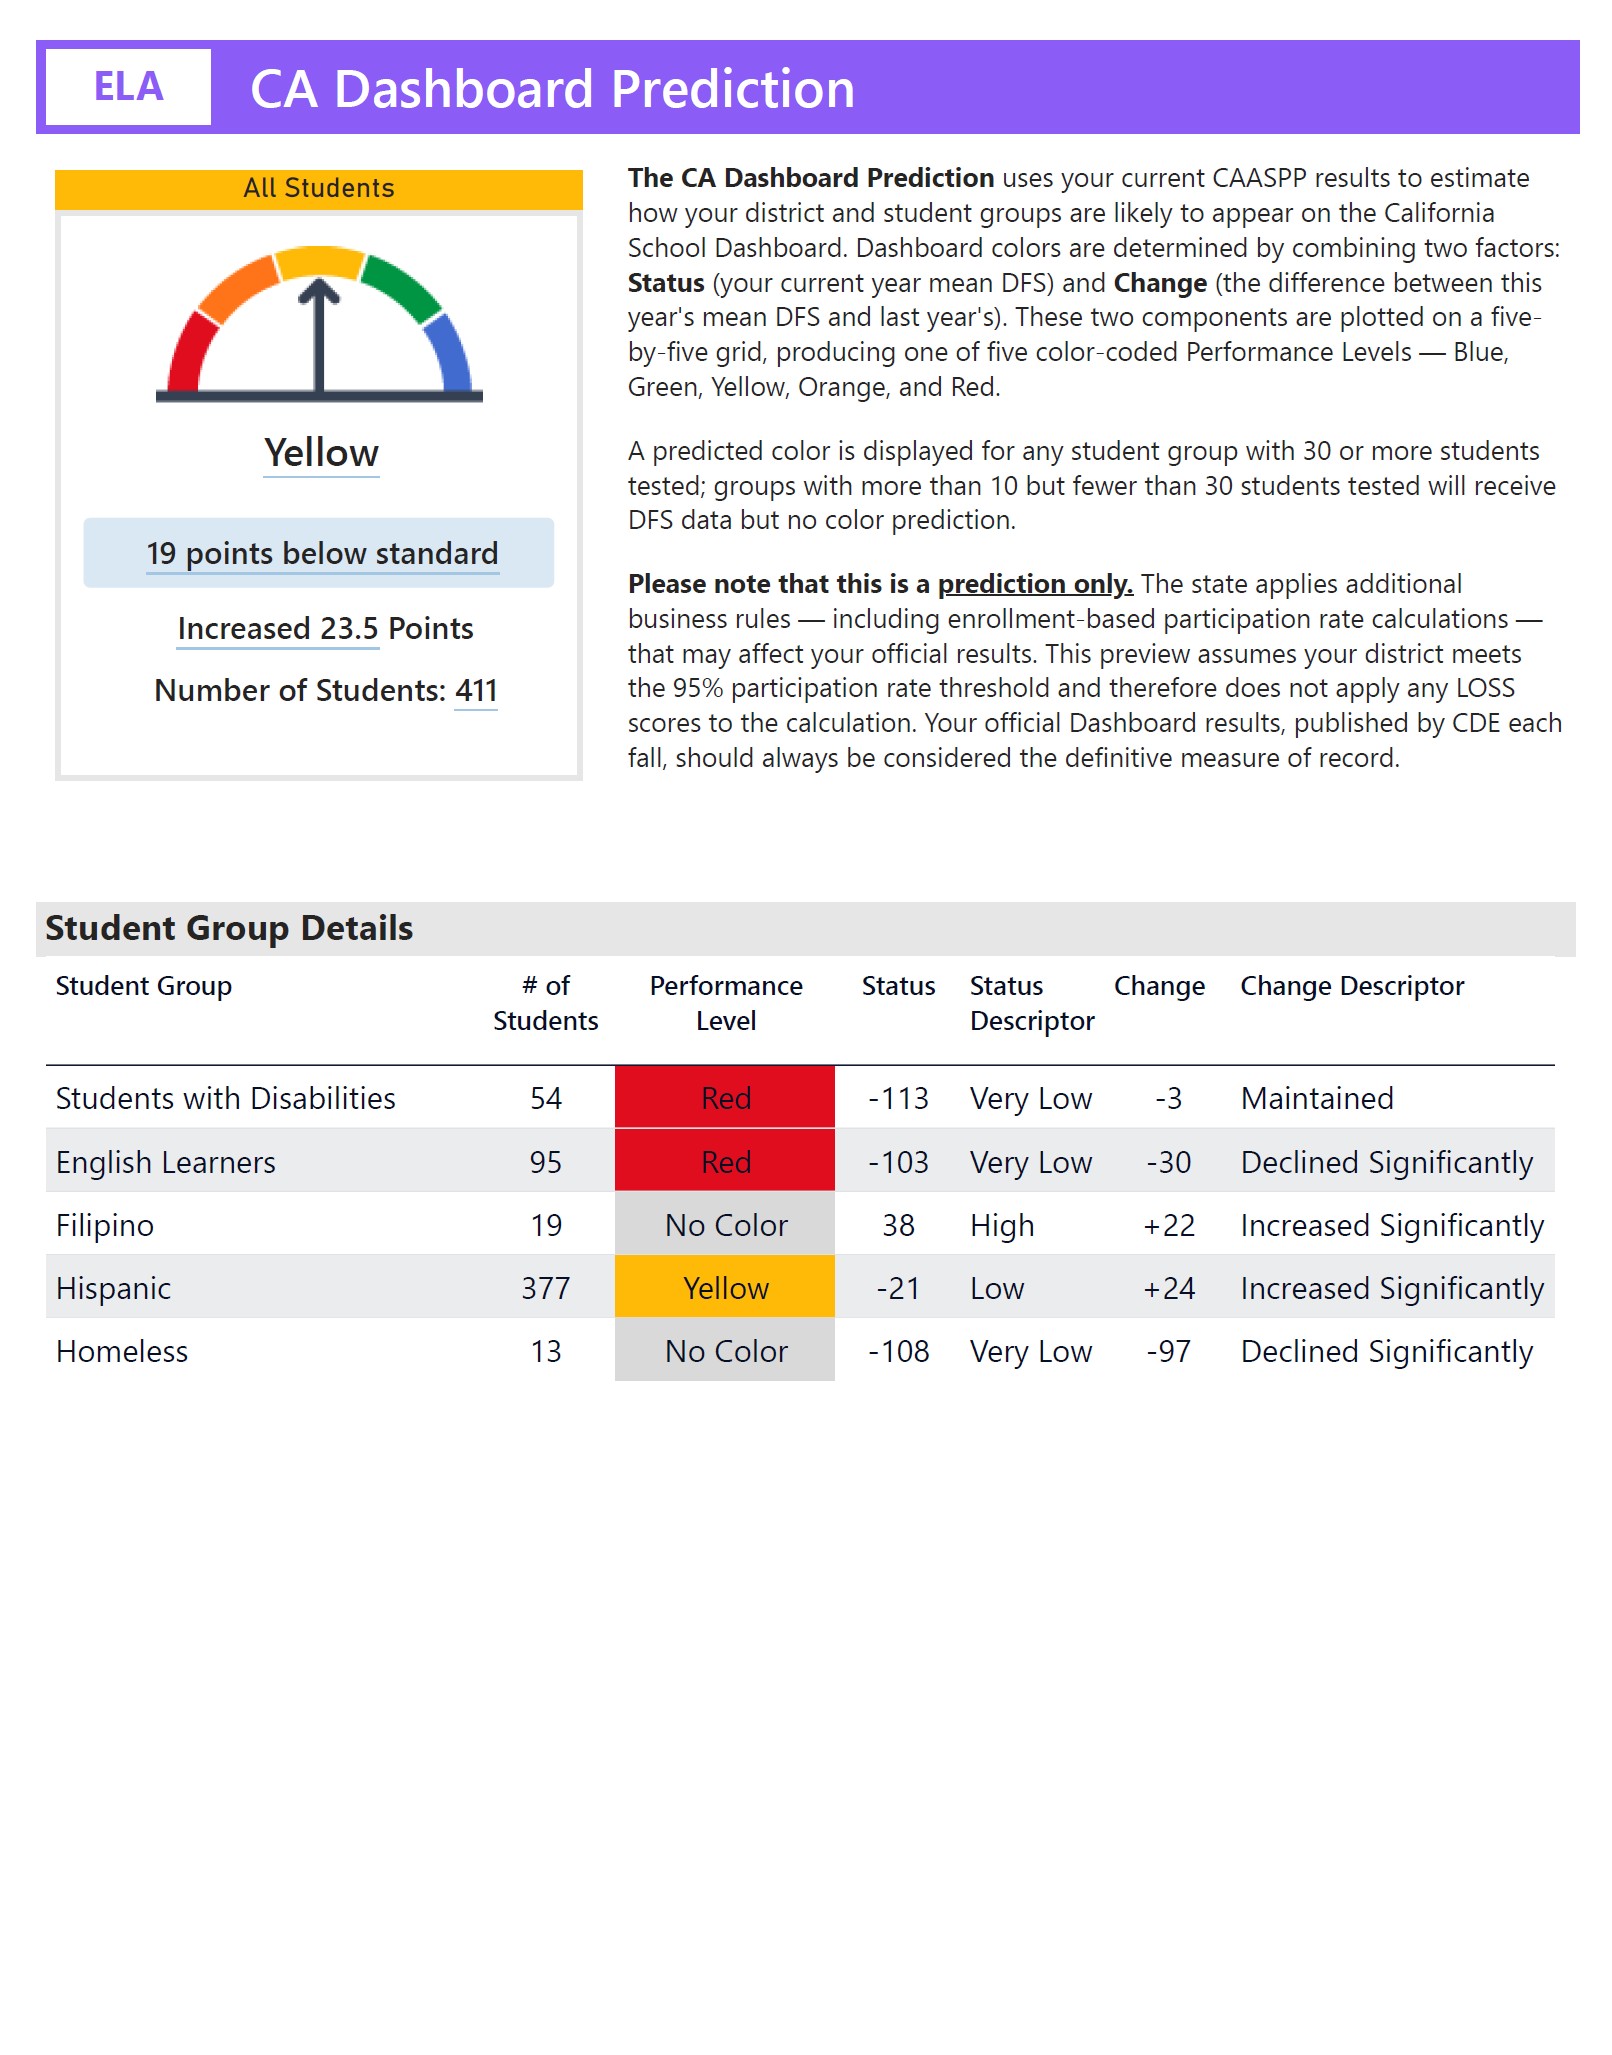
Click to enlarge
Book a free 20-minute consultation. We'll learn where your district is, what your CAASPP results have looked like, and whether this package would be a good fit. No commitment, no pressure—just a real conversation.
Seven deliverables, each designed for a specific audience and purpose.
Three separate focused reports—ELA, Math, and Science (CAST)—each built around the questions that matter for that content area. Organized for curriculum leads and content coaches, not just data staff.
Student-level performance data paired with specific, prioritized next steps for principals and instructional coaches. The bridge between system-level analysis and individual students.
A live Power BI dashboard you can filter by site, grade, subject, and student group. Built for exploration, leadership meetings, and ongoing reference throughout the year.
A standalone report showing what your current results predict for your California Dashboard accountability ratings—by indicator and student group—before the Dashboard is published.
A high-level overview of your district's results—key metrics, notable trends, and the context your board needs to have an informed conversation. Built for leadership, not data staff.
A structured guide for leading your team through a data-focused professional development session—systems analysis, root-cause conversation prompts, and a clear flow from results to priorities. No outside facilitator required.
Multiple formatted Excel workbooks built from your student-level TOMS data—color-coded, filterable, and organized for your team's own ongoing analysis work throughout the year.
A one-time flat fee. No per-student pricing. No ongoing subscription.
Built from your district's actual data. The right starting point for understanding your results, communicating them to your board, and setting instructional direction before the year begins.
Site-level add-ons are available for districts that want the same analysis broken out by individual school site. Contact us to discuss scope.
All deliverables provided as a secure file package—PDFs, Excel workbooks, and the interactive dashboard access—delivered within 10 days of your CAASPP results being available.
Book a free 20-minute consultation. We'll ask about your district's situation—enrollment, sites, recent results, what questions keep coming up—and you can ask us anything. If it's a good fit, we'll tell you. If it isn't, we'll tell you that too.
Book a Free Consultation